How can you manually attach a debugger to the Azure Web App?

“Remote debug your Azure App Service Web App” how to use Cloud Explorer to remotely attach a debugger to an Azure App Service in Visual Studio 2015, now let’s see how you can do the same in 2017.
To configure and remote debug your Microsoft Azure App Service Web App, you will need to perform the followings:
- Have a Web App deployed to the Azure platform.
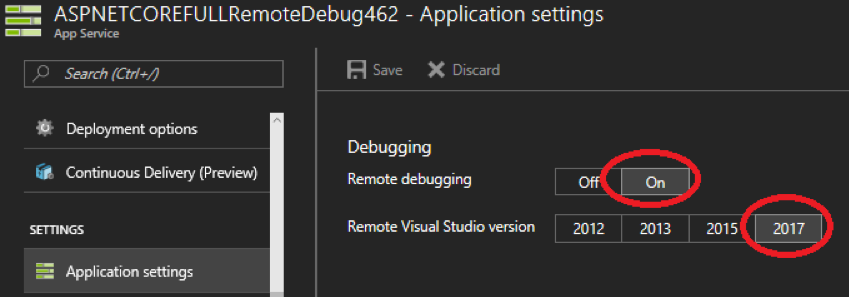
- Attach the remote debugger to the Web App.
- Confirm the remote debugger is attached to the W3WP process.
- Set the breakpoints.
- Manually debugging.
Attach the remote debugger to the Web App

Please also make sure when deploying the app, Debug configuration is selected. For example: in Visual Studio Web Deploy…

From the main menu, click on the Debug menu item and select Attach to Process.

Set the break points.

I resolved this disabling “Enable Just My Code” from the Tools –> Options menu in Visual Studio

Site Re-Deployed
Finally, open the Azure App Service in a browser, navigate to the location where you expect to hit the breakpoint and the execution will stop at the breakpoint for further analysis.
Happy debugging manually Attach a debugger to the Azure Web Apps.
The best technology solution would definitely help you to become as a successful entrepreneur, and the Ceymplon (Pvt) Ltd is an IT solution service provider which has excellent experience in the field dedicated to delivering the best services to its clients on business consultation in manually attaching a debugger to Azure the web app. For more information, https://www.ceymplon.lk/service/it-service/tech-consultancy

